

Case study: Oxford Test of English
Developing and launching a high stakes English language proficiency test certified by Oxford University.
Overview
The Oxford Test of English is the only English language proficiency test certified by Oxford University. It is available in approved test centres worldwide and was a finalist for ‘Best in summative assessment’ at the 2020 e-Assessment Awards.
The adaptive test can be taken in a much shorter time than a conventional proficiency test, at 2 hours for the test itself with students receiving their results within 2 weeks.
Problem
The company had unsuccessfully tried to develop and launch a global adaptive English language proficiency test three times before. The closest implementation that reached end users was released only in Spain and was not technically sound enough to be scaled and delivered to a global audience. The previous implementation also had many experience and usability issues that meant porting the product from one developer to another would not have been practical or sufficient for certification by Oxford University.
Before UX was brought into the project, a new development partner had already been selected, which placed contractual restrictions on the scope of the project.
The Assessment lead requested my input, from previous experience of working with me. They needed someone who could focus on user input and the design approach and who could finally lead the project to success.
Approach
As the UX and UI lead on this project, I was responsible for coordinating all user experience research, wireframing, prototyping, user testing, and had direct input into coordinating the technical development.
I spent time embedded with the third party development team and collaborated closely with the internal project team and senior stakeholders.
Challenges and their mitigations
-
The team had attempted to develop the Oxford Test of English unsuccessfully three times before this project.
Mitigations:
Heuristic reviews of previous implementations.
“Lessons learned” analysis.
Early stakeholder one-to-ones.
-
There was a discrepancy between the product’s team vision and the technical limitations of the third party developer’s chosen SaaS platform.
Mitigations:
Analysed the capabilities of the platform.
Held workshops on new development features.
Conducted frequent hands-on product exploration sessions with stakeholders.
-
Global performance issues of the current platform.
Mitigations:
Performed global user acceptance testing (UAT) with real users.
Outlined clear success criteria.
Gathered user metrics between studies.
-
This was the first time the team had worked with a UX designer.
Mitigations:
Emphasised the benefits of a user-centred approach to development in written principles.
Played back real user experiences of the in-development software to the team.
Led in conversations with the developer and embedded into their team.
-
High-profile project involving multiple senior stakeholders and their competing concerns.
Mitigations:
Engaged with key stakeholders throughout to understand their concerns.
Brought groups together to gain a shared consensus of what we were trying to do.
Invited stakeholders to participate in usability sessions.
-
Some solution aspects had already been contractually agreed.
Mitigations:
Gained thorough, high-level understanding of the SaaS software we were adapting.
Demonstrated alternative approaches within the constraints of the system to lessen the negative impact those earlier solution decisions may have had on the end user.
Research
Research was conducted throughout the length of the project, from desk research of competitor tests and heuristic reviews of existing implementation, to small-scale usability testing and large global testing sessions in real user environments.
Having research baked into all stages of the project allowed the team to have immediate feedback on decisions that were being made or taken. It also gave greater voice to the end users who had not featured so prominently in previous test developments.
A human-centred approach had not been consciously used by the team before, so my role was to lead them through undertaking a user-focused approach rather than a purely academic or technical one.
The results were presented back to the business and informed workshop discussions, moving decision-making towards a better balance between what works for the business and what works for end users.

Storyboarding: Investigating a previous implementation for a workshop session, relating it back to user research findingsStakeholder engagement
As a complex project involving numerous departments, experts and third parties, it was important to take any opportunity to conduct stakeholder workshops, interviews and demos, while encouraging all roles to participate and observe user testing whenever it was conducted.
One of the core methods I used was Customer Experience Journey Mapping (CXJM), otherwise known as journey mapping, to visualise the process that our personas go through to accomplish a goal.
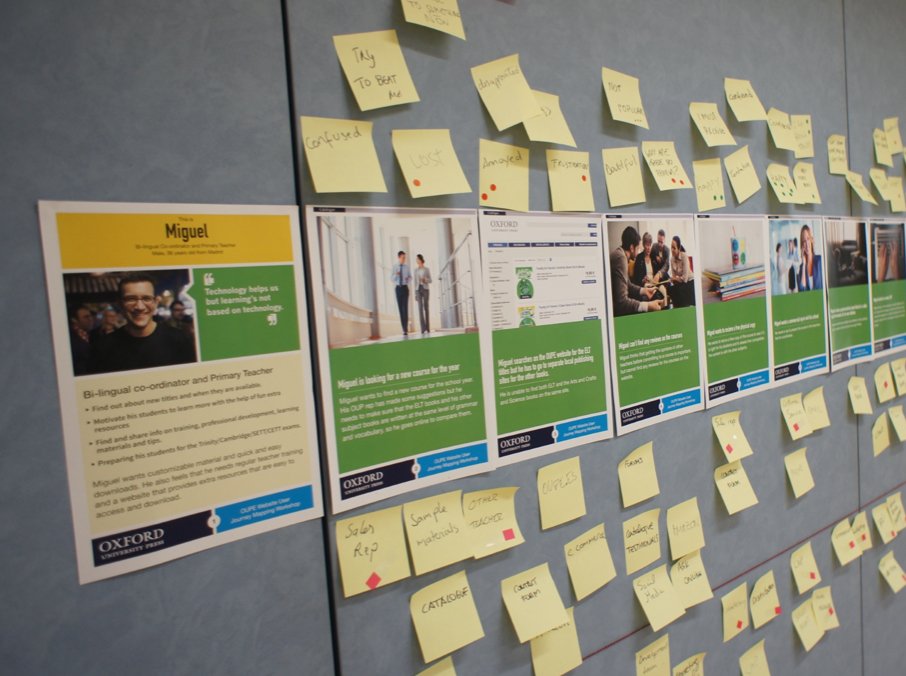
Customer Experience Journey Mapping (CXJM) workshop with stakeholdersWe looked at the processes for test centre managers, students, test takers with special requirements, and business staff who were important to the success of the project.
By using this method, we were able to gain a shared understanding of what the user problems we were trying to solve were, and to align the team’s goals. Collaborative sessions allowed all members of the team to express their thoughts in a structured way, which we documented in an artefact so that we could keep referring to it when making decisions later in the process.
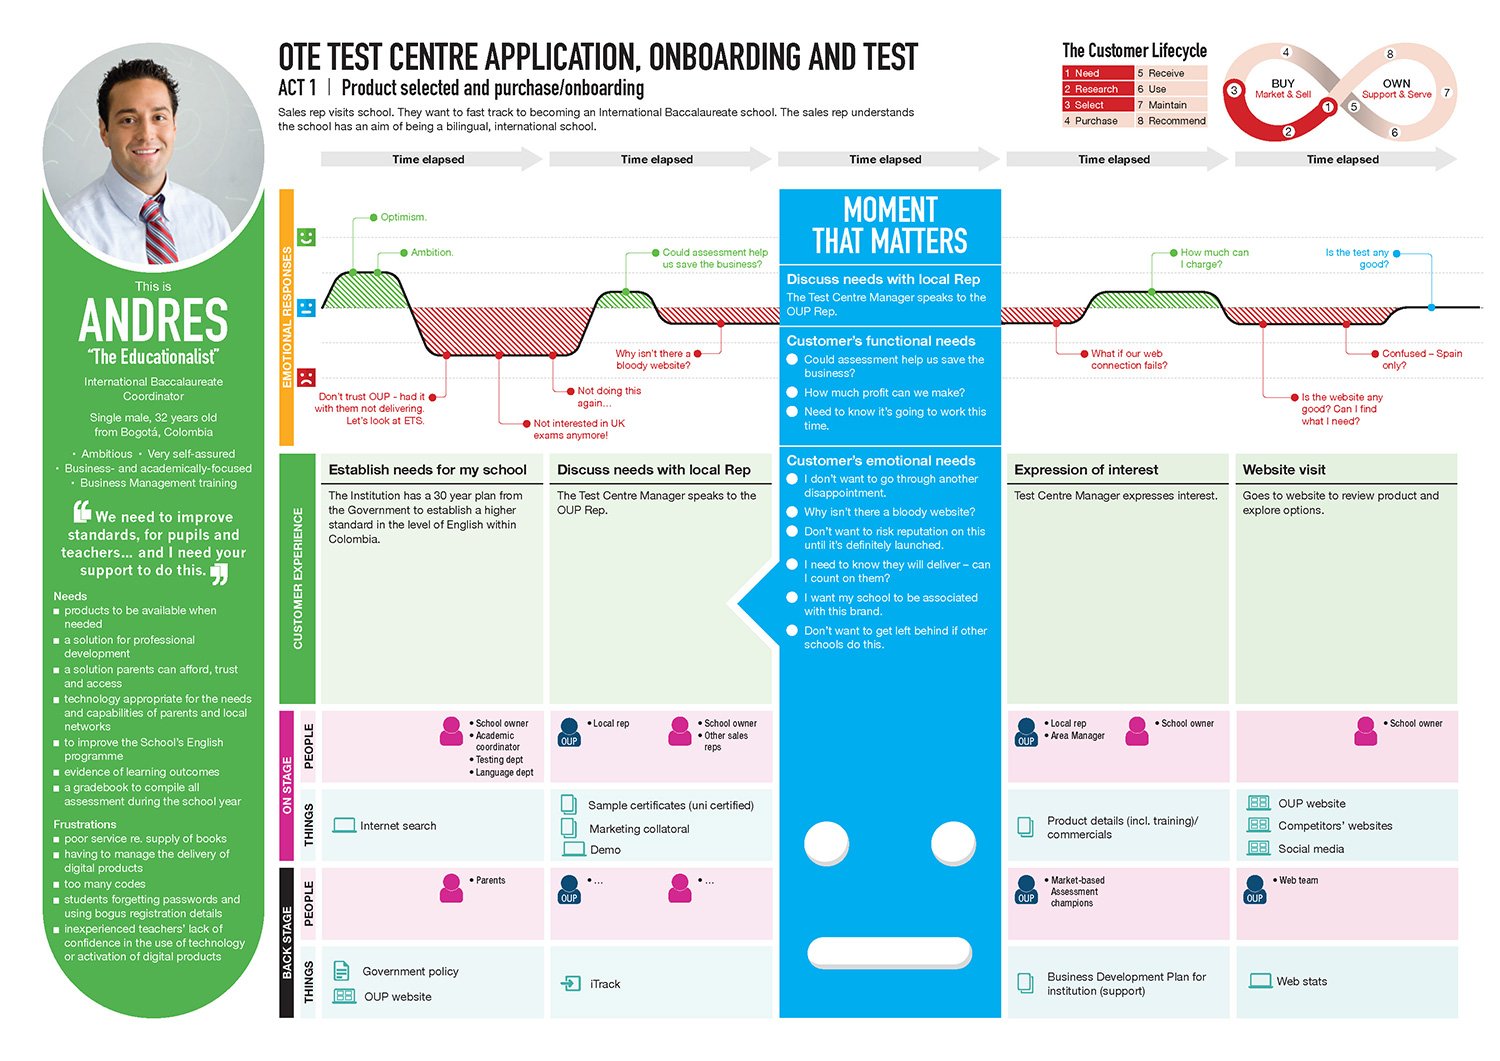
Section of a Customer Experience Journey MapFlows
User flows were created to map out the test and other aspects of the systems that administer it. These were iterative developments over time with key stakeholders reviewing, advising and adapting elements together.
Flows were used as an initial explorative technique to reveal inefficiencies or broken parts of the assumed experience. The method allowed us to avoid costly development rework and to connect ideas between the assessment editorial team and the third party development team.

Flows: Mapping out the test flow for the test taker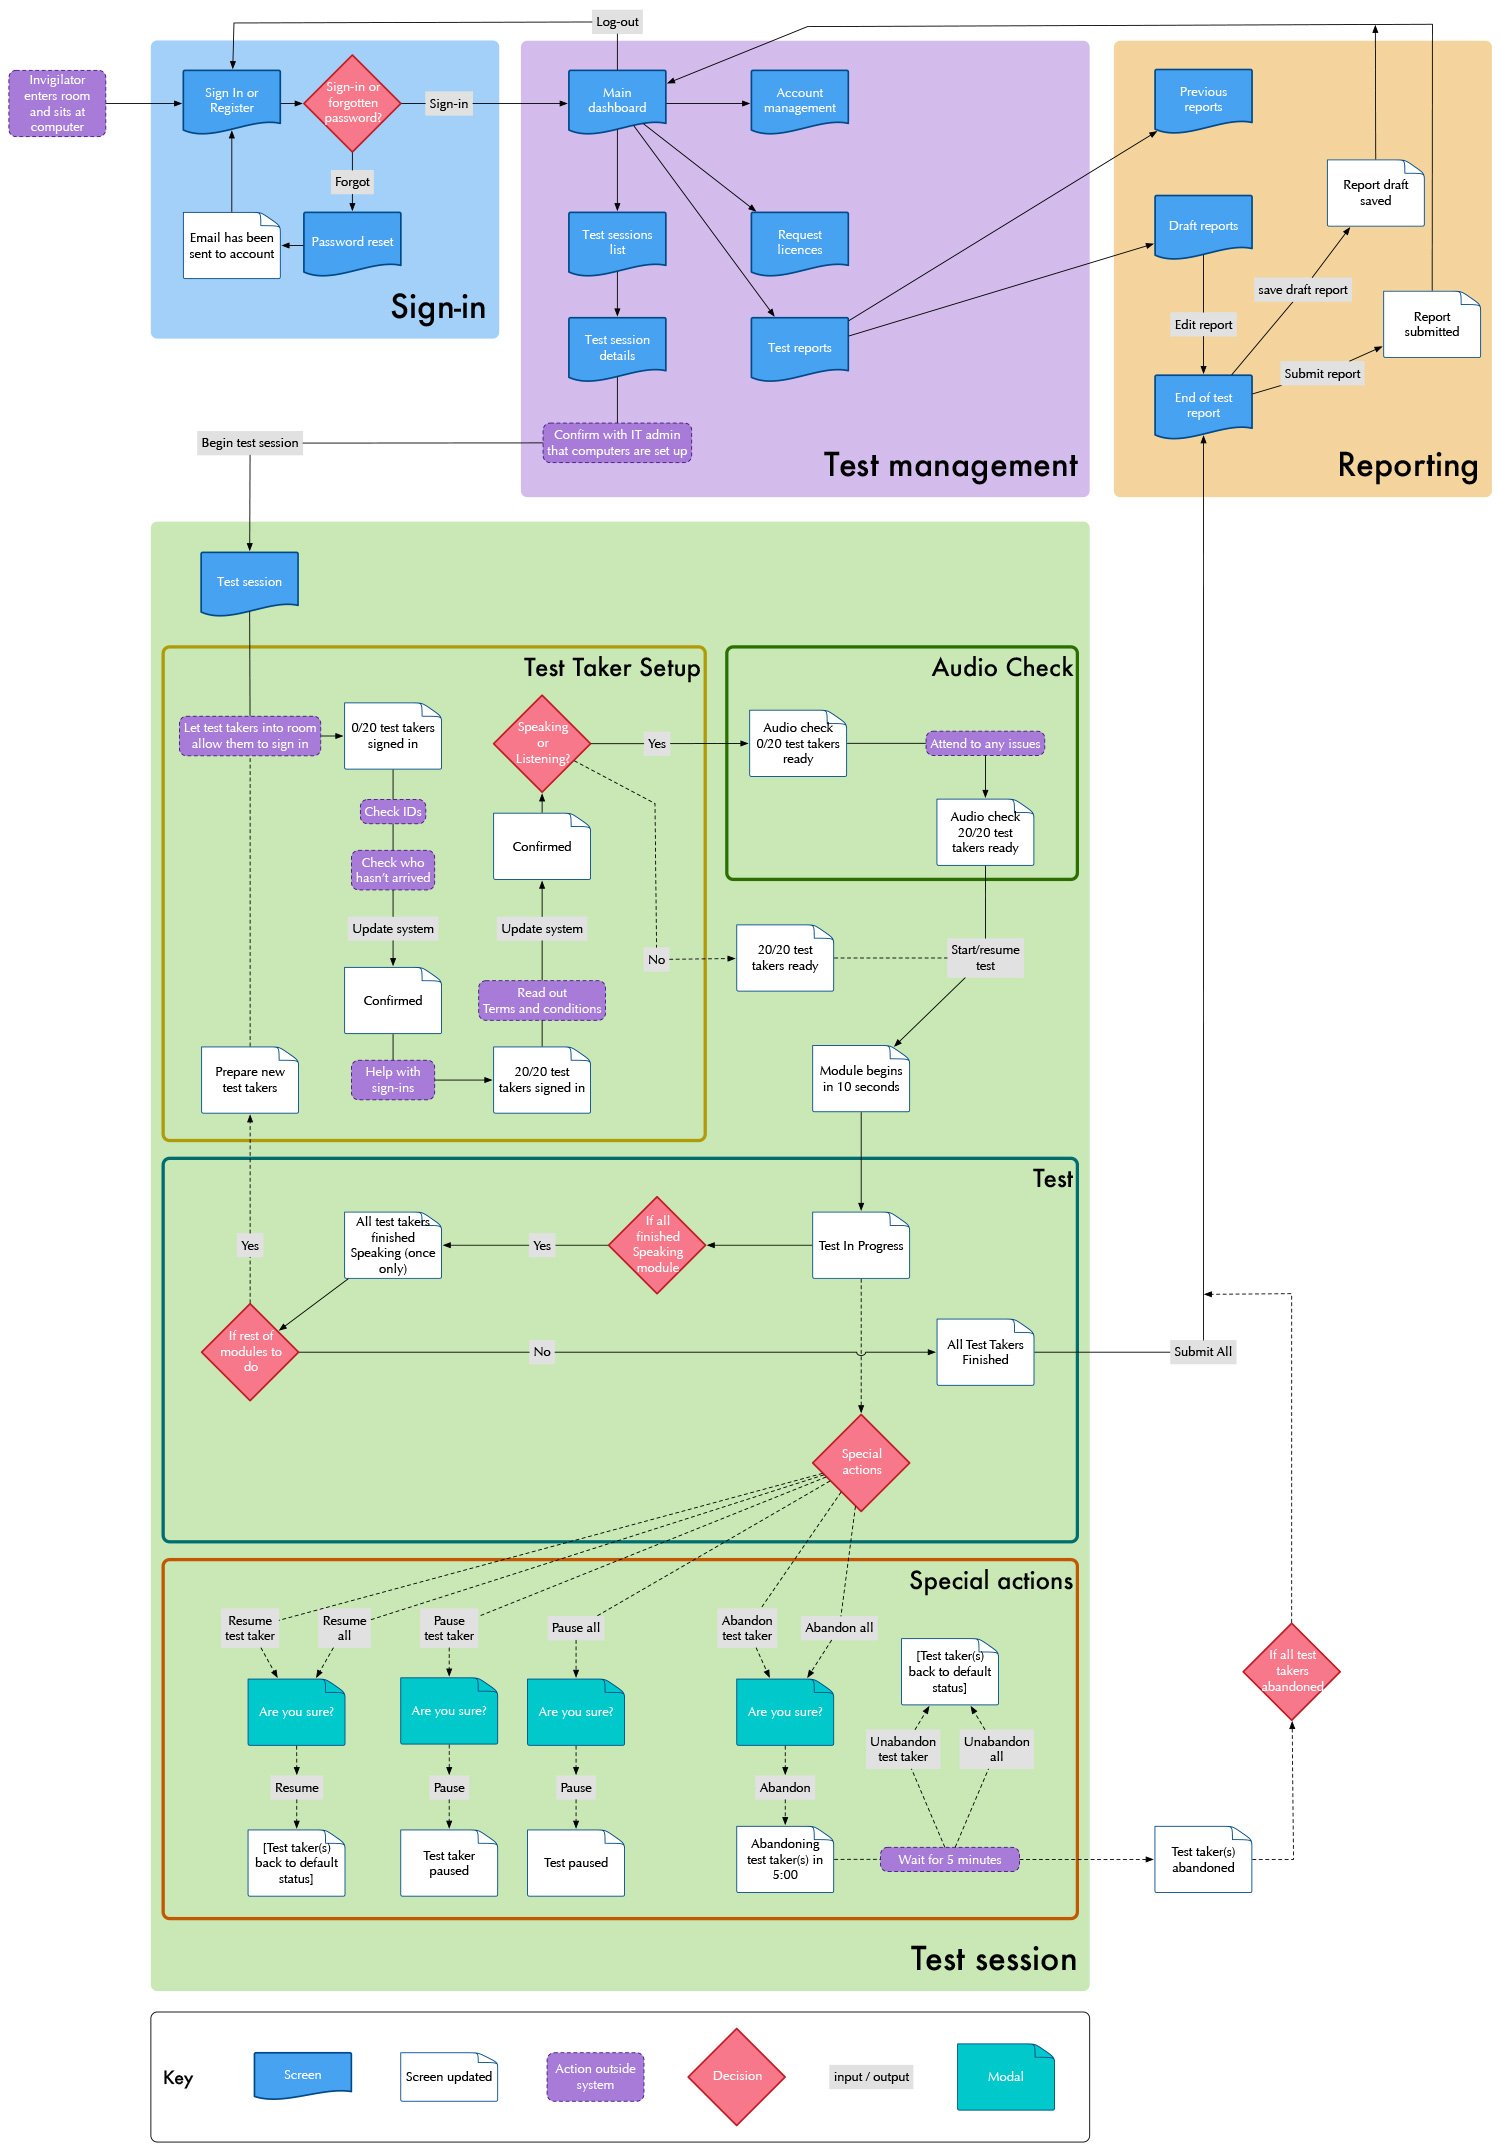
Flows: Mapping out the test management for invigilatorsWireframes
When iteratively wireframing the test screens, I had to follow specific test validity guidelines to retain Oxford University test certification. The content had been pre-tested, researched and crafted heavily to meet pedagogical aims and examine student’s language proficiency accurately.
I took great care to remain mindful of the content when analysing how we might incorporate the ideals into the technical constraints of the business’s chosen test platform, which I invested a lot of time to understand. Those technical constraints appeared inflexible, but I was able to problem-solve and found solutions between the technical and assessment teams, which pushed the platform beyond what it had been able to deliver before.

Examples of ideation sketching phases for test layoutsWireframes and prototypes were created from paper to HTML. These detailed the test design elements: a calm feel to minimise test takers’ stress, accommodation of test standard constraints, and to be feasible within a locked-down browser.
Accessibility was also a key consideration in the interface design. The standard version of the test needed to be as accessible to as many test takers as possible, to WCAG 2.1 standards. High-contrast, larger text format and muted-colour versions were incorporated into the design to further widen the ability to meet test taker needs.

Wireframing test screen detailsTesting
Testing was conducted throughout the development of the product with both internal stakeholders and end users from across the globe.
Testing was not only important to measure whether the test was performant in different locales, but also to demonstrate the test taker and invigilator experiences as realistically as possible.
My role involved defining all the test scenarios, creating all guidance documentation, conducting post-test surveys, applying in-test SEQ, doing observations, holding interviews, running test sessions, organising participants, following up with them, analysing data, writing up the reports, and presenting back to stakeholders.
Below is some more detail about the areas looked at in these studies.
Task completion rate is one of the simplest measures of whether a system is usable.
By measuring the binary task completion rate, where a task scores 1 for successful completion and 0 for a failure, we can objectively measure whether a user is able to complete a task or not.
In user testing, we used the scale of Pass (1), With Issues (-), where a user could eventually complete the task within allowance but with some margin of error, and Fail (0).
Using this simple measure, I was able to illustrate the problem that a high numbers of test takers were not actually be able to finish the test owing to a technical issue or miscommunication in the interface design, which I could then propose solutions for.

Measuring task completionMeasuring the perception of how performant a system is is as important as how it is technically tracked. I measured how test takers felt about performance as well as the ease of use of aspects of the system. Confidence intervals were given to promote larger sample sizes in later studies so that the accuracy of the data could be improved.

Measuring perceived acceptable performanceA Likert scale is one many of us will have seen before – it’s usually a five-point scale from ‘strongly disagree’ to ‘strongly agree’, where we’re asked to rate our agreement with a statement on a topic, e.g. satisfaction, usability, or loyalty.
In testing, I used the standard five-point Likert scale to capture test taker feeling, using faces from smiles to frowns, where users measured different moments in the test.
The average internal test taker response throughout the test was around 80%, but it was important to illustrate the dips in experience, which surfaced most in signing in, sound check, and the early parts of the test. This helped direct further investigations.

Measuring the emotional responseAesthetics and attitudes towards the desirability of a product can be measured against satisfaction rating scales and through qualitative survey analysis, as well as through the Microsoft Desirability Toolkit (otherwise known as the Microsoft Card Reaction Method).
The full toolkit contains 118 physical cards with different reaction words written on them, of which users are asked to select 5 at the end of a test.
All the test takers that would take this type of test are not native English speakers and would be unlikely to understand some of the more advanced words in the Microsoft Desirability Toolkit.
As part of user testing, I adapted the list to bring the language level down to CEFR A2 (with the exception of ‘trust’ being a B1 word) and shortened the list to 59 words.

Measuring desirabilityImplementation
I was heavily involved in the implementation of the test and provided on-site expertise and guidance at the developer’s offices in Cambridgeshire. This involved many visits to help manage the alignment of stakeholders and developers, the business and the technology.
All design specifications considered the complexities of the developers’ system and designs were adapted to best meet user needs, business stakeholder expectations and technical feasibility. I did this in lean sprints with space in between to conduct usability studies to validate and challenge assumptions in the design.
By working cooperatively with all parties, I was able to keep the project on track through to completion.
How was success measured
Global sales and test centre adoptions – the test is currently available in 29 countries and over 470 test centres.
Reductions in customer service complaints when compared to previous test implementations.
Positive feedback from sales reps on the support mechanisms we brought in to aid their roles.
High performance against key business KPIs.
Improved results in summative UX studies post launch.
Below is a video about the positive impact the test has had on people’s lives.